![]()
Important
Recipe Terminology:
self=MapData
self.bot=sc2.bot_ai.BotAI
PathFinding Terminology:
cost: How much is it going to cost the pather to walk through this cell
weight_array: a finalized grid(with added cost) passed to plotting
the optimal cost will be 1,
the worst cost would be
numpy.inf(for non pathable cells)
you should keep that in mind if you want to create a complex influence map with different weights
Be sure to check out dummybot.py for example bot usage with some handy debug methods
Building Grid - Recipes
Find wall off building positions in a Region
Buildables.polygonBuildables.points
>>> my_base_raw_location = self.bot.townhalls[0].position
>>> my_region = self.where_all(my_base_raw_location)[0]
>>> my_region
Region 3
>>> # in most cases  region will have only one ramp,  but there are cases of more than one
>>> # my_region.region_ramps will evaluate to ~ [<MDRamp[size=33] [Region 3, Region 5]>, <MDRamp[size=58] [Region 3, Region 0]>]

>>> my_region.region_ramps.sort(key=lambda r: r.area)
>>> my_region_ramp = my_region.region_ramps[0]
>>> # my_region_ramp ~  <MDRamp[size=58] [Region 0, Region 3]>
>>> # my_region_ramp.buildables ~ <MapAnalyzer.Polygon.Buildables object at 0x...>

>>> # you can also see that these buildable points only belong
>>> # to this specific Polygon, in our case MDRamp

>>> # my_region_ramp.buildables.polygon ~ <MDRamp[size=58] [Region 3, Region 0]>

>>> # low buildable percent makes sense, most of the ramp's Polygon is not buildable
>>> # my_region_ramp.buildables.free_pct ~ 0.22413793103448276

>>> # finally,  the buildable points,  which are the ramp wall-off positions
>>> my_region_ramp.buildables.points # finally,  the buildable points,  which are the ramp wall-off positions
[(42, 43), (46, 47), (44, 45), (47, 38), (49, 40), (41, 42), (43, 44), (48, 39), (46, 37), (45, 46), (41, 41), (50, 41), (46, 46)]

>>> # lets plot those buildable points
>>> x,y = zip(*my_region_ramp.buildables.points)
>>> # self.debugger.scatter(x,y,color="red",marker=r"$\heartsuit$", s=500, edgecolors="r")
>>> # self.show()
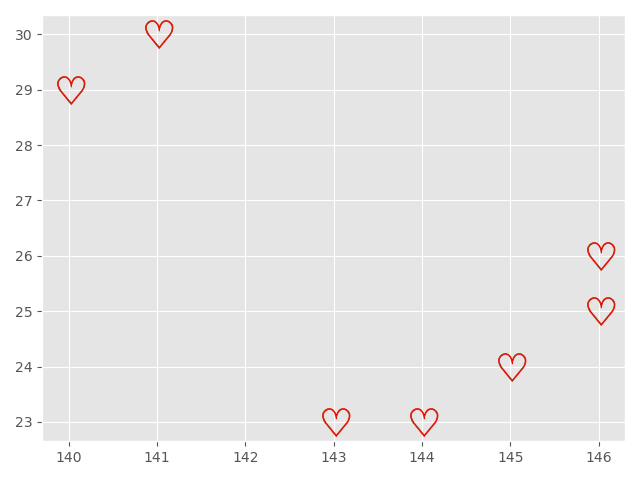
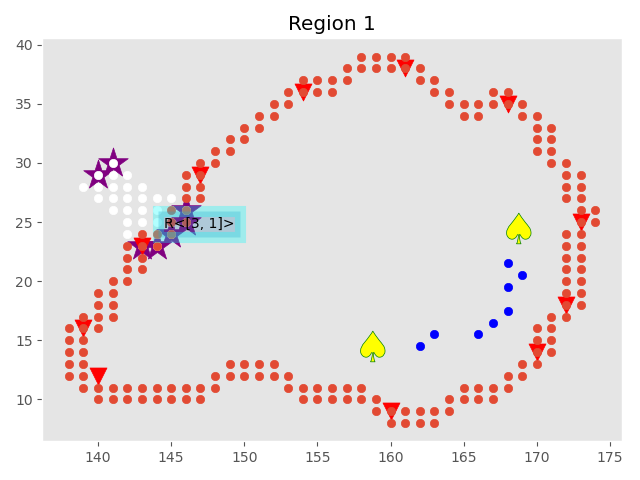
Hmm, it seems that these points look like they are the upper and lower end of a ramp, lets make sure:
>>> # the perimeter is red by default so we will
>>> # also,  lets change the heart suit to a simple Star marker and remove the edge color
>>> self.debugger.scatter(x,y,color="purple",marker='*', s=500)
>>> my_region.plot()
>>> # self.show()
Indices and tables